Operations Guide
Hawiyati exposes structured metrics via Prometheus and OpenTelemetry through the hawiyati-audit module. Each service also exposes a Spring Boot Actuator health endpoint at GET /actuator/health.
Hawiyati exposes structured metrics via Prometheus and OpenTelemetry through the hawiyati-audit module. Each service also exposes a Spring Boot Actuator health endpoint at GET /actuator/health.
The sections below cover operations, monitoring, backup, disaster recovery, and incident response. For a full module map with ports, gRPC boundaries, and deployment topology, see the Implementation Guide.
1. Monitoring & Alerting
Hawiyati exposes structured metrics via Prometheus and OpenTelemetry through the hawiyati-audit module. Each service also exposes a Spring Boot Actuator health endpoint at GET /actuator/health.
1.1 Key Metrics
The following metrics should be tracked continuously in production:
| Metric | Description | Source |
|---|---|---|
| Login success rate | Ratio of successful to total login attempts | hawiyati-audit Prometheus |
| Login failure rate | Failed logins per minute, per IP, per user | hawiyati-audit Prometheus |
| Active session count | Current sessions in Redis | hawiyati-session gRPC + Redis INFO |
| MFA success/failure | Per-factor MFA completion rates | hawiyati-audit Prometheus |
| SAML assertion issuance rate | Assertions signed per minute per SP | hawiyati-audit Prometheus |
| OIDC token issuance rate | Tokens issued per minute per client | hawiyati-audit Prometheus |
| KYC session completion rate | KYC sessions reaching APPROVED state | hawiyati-kyc Prometheus |
| Risk engine block rate | Requests blocked by risk engine per hour | hawiyati-audit Prometheus |
| Login latency p95 | 95th percentile end-to-end login duration | OTel traces |
| Redis hit/miss ratio | Cache effectiveness (sessions, SP config) | Redis INFO stats |
| PostgreSQL connection pool usage | Active vs max pool connections per service | HikariCP metrics |
| Disk usage | DB data dir, log dir, audit export dir | Node exporter |
1.2 Alert Thresholds
| Metric | Warning | Critical | Routing |
|---|---|---|---|
| Auth failure rate | >10% | >25% | Ops + Security (anomaly) |
| Login latency p95 | >500ms | >2s | Ops pager |
| Redis connection failures | — | Any | Ops P1 pager immediately |
| PostgreSQL connection pool | >80% | >95% | Ops pager |
| Session creation failures | >1% | >5% | Ops pager |
| Disk usage | >70% | >85% | Ops (capacity planning) |
| TLS certificate expiry | <60 days | <14 days | Ops + Security |
| Risk engine block spike | 3× baseline | 10× baseline | Security team |
1.3 Recommended Monitoring Stack
Hawiyati metrics are compatible with standard Prometheus scraping. Recommended stack:
- Prometheus — scrape
/actuator/prometheuson each service (port varies per service) - Grafana — dashboards for auth rates, session counts, latency histograms
- OpenTelemetry Collector — aggregate OTel traces from hawiyati-audit; forward to Jaeger or Grafana Tempo
- Alertmanager — route alerts: P1/P2 → ops pager (PagerDuty/OpsGenie), anomaly spikes → security team Slack
1.4 Health Endpoints
| Service | Health Endpoint | Expected Response |
|---|---|---|
| hawiyati-gateway | GET http://localhost:8080/actuator/health | {"status":"UP"} |
| hawiyati-http-server | GET https://idp.hawiyati.org:8085/actuator/health | {"status":"UP"} |
| hawiyati-admin | GET https://localhost:8095/actuator/health | {"status":"UP"} |
| hawiyati-scim | GET https://localhost:8098/actuator/health | {"status":"UP"} |
2. Log Management
Hawiyati produces two distinct log streams: structured audit logs (compliance-grade, CEF/JSON format) and standard application logs (Spring Boot Logback).
2.1 Audit Log Format
Every audit event always contains these fields:
| Field | Type | Description |
|---|---|---|
@timestamp | ISO-8601 | Event time in UTC |
service | string | Originating service name |
category | enum | AUTH, ADMIN, SESSION, KYC, SCIM, POLICY |
action | string | Specific action (e.g. LOGIN_SUCCESS, POLICY_UPDATED) |
outcome | enum | SUCCESS, FAILURE, DENIED |
severity | enum | INFO, WARN, ERROR, CRITICAL |
actor.id | UUID | ID of the acting user or admin operator |
actor.type | enum | USER, ADMIN, SYSTEM, SCIM_CLIENT |
message | string | Human-readable event summary |
2.2 Retention & Rotation
| Log Type | Format | Retention | Notes |
|---|---|---|---|
| Audit logs | JSON / CEF syslog | Minimum 12 months | Compliance requirement; append-only |
| Application logs | Logback text / JSON | 90 days | Daily rotation; compress after 7 days |
| Access logs (gateway) | Common Log Format | 30 days | High volume — aggregate before archiving |
2.3 SIEM Integration
Forward audit logs to your SIEM via syslog (TCP/TLS recommended). Hawiyati-audit supports:
- Syslog over TCP (RFC 5424)
- File-based JSON for Filebeat/Fluentd pickup
- OpenTelemetry log exporter (OTLP/gRPC)
2.4 Admin Console Export
Search and export audit logs from the admin console (Admin → Audit Logs). Export formats: CSV and JSON. Maximum export size: 50,000 rows per export. For larger exports, use direct DB queries against hawiyati_config.audit_events or query your SIEM.
2.5 Log Levels
Adjust Spring Boot log levels at runtime without restart via POST /actuator/loggers/{name} (admin console access only). In production, default to INFO. Enable DEBUG for specific components only during active troubleshooting — DEBUG logging at scale generates significant volume.
# Example: enable debug for the risk engine component
curl -X POST https://idp.hawiyati.org:8085/actuator/loggers/hawiyati.risk \
  -H "Content-Type: application/json" \
  -d '{"configuredLevel":"DEBUG"}'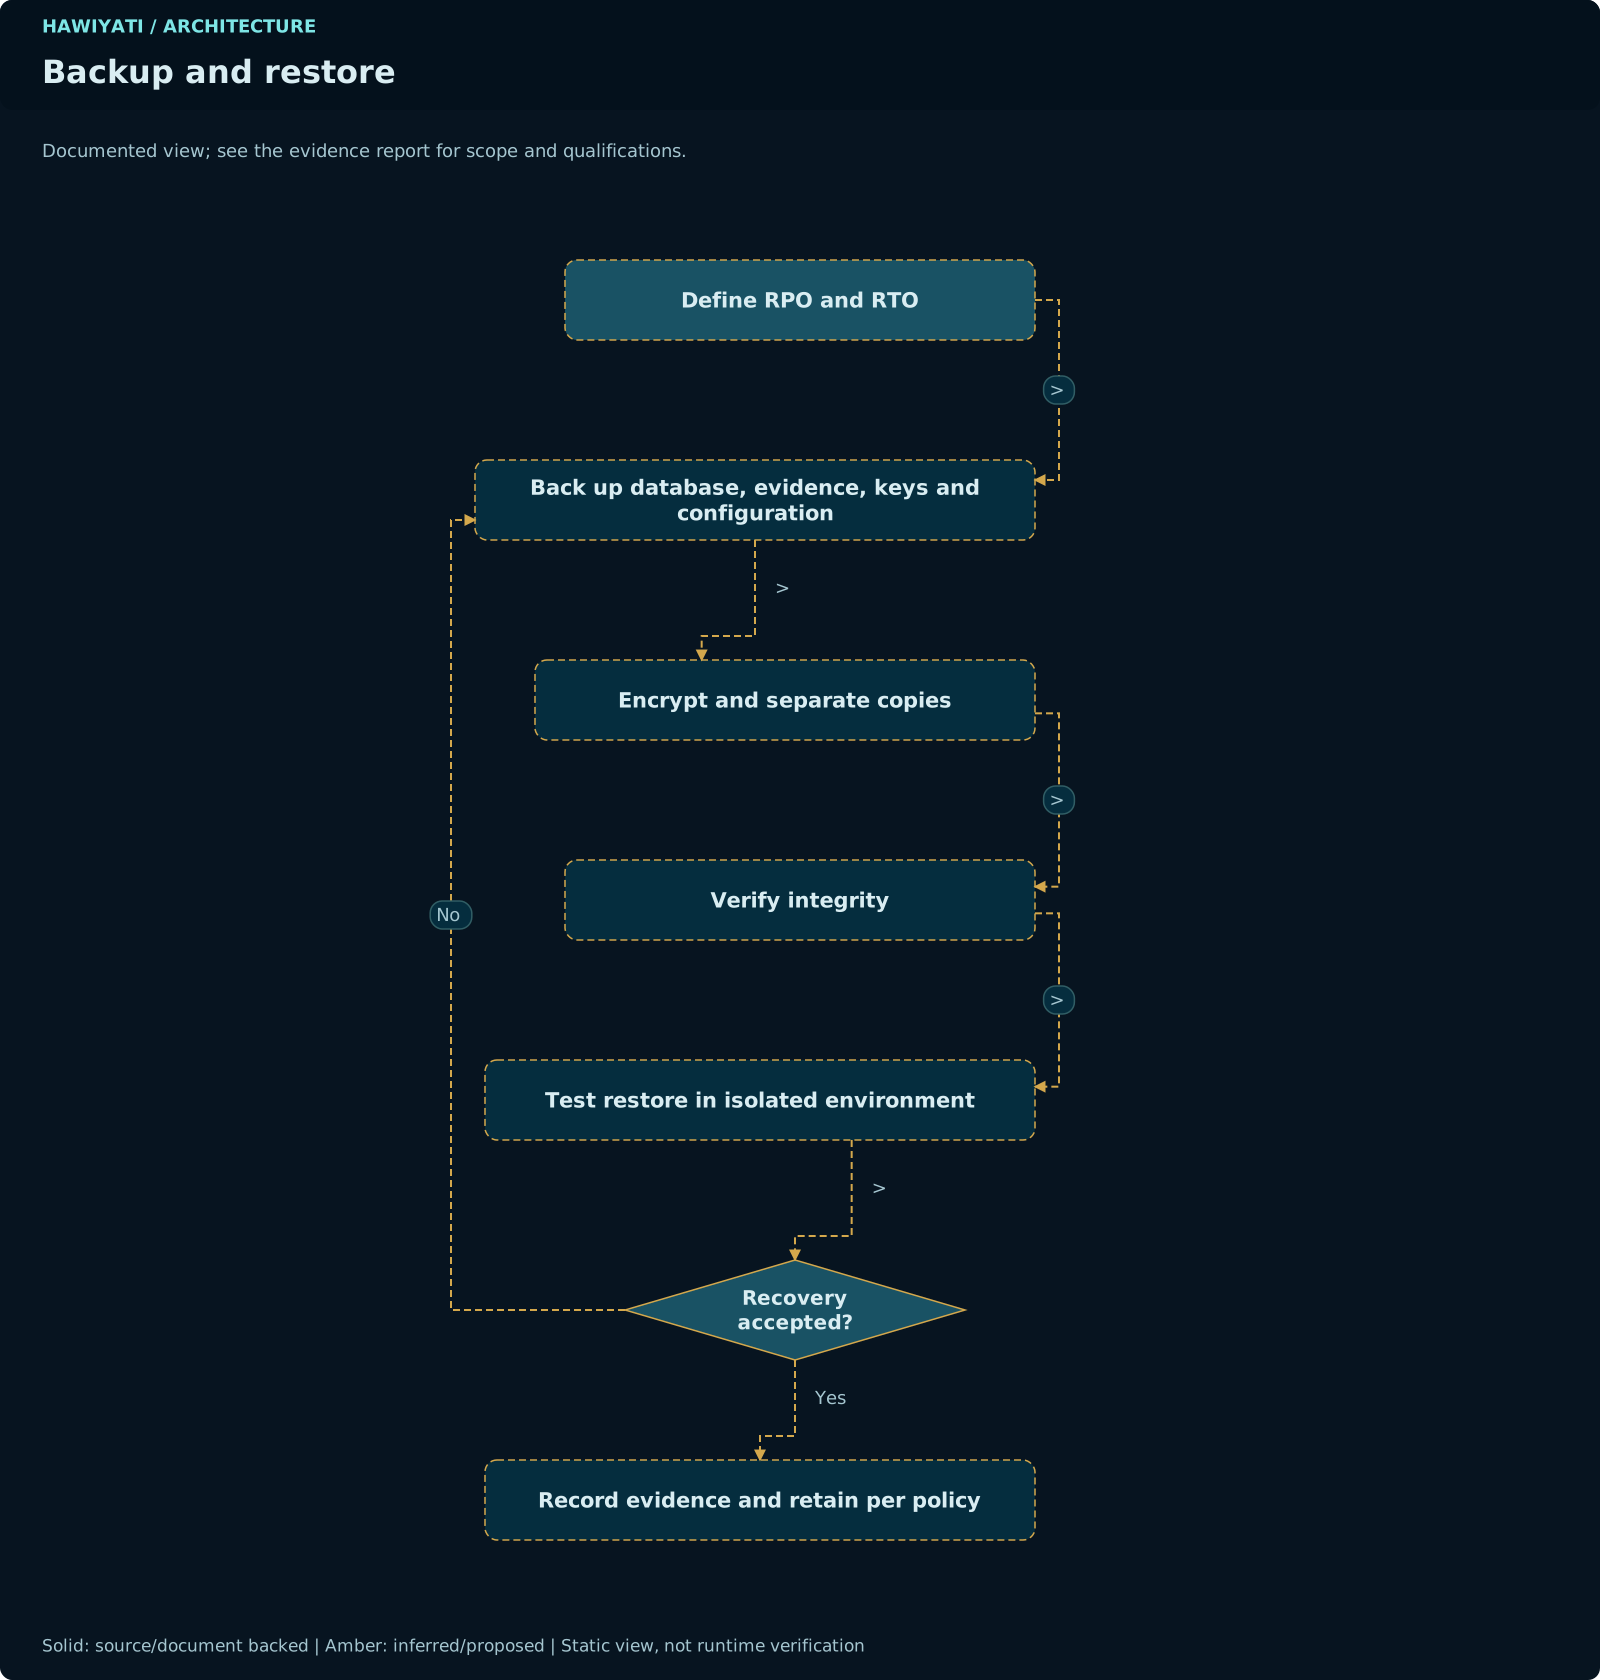
3. Backup & Restore
Hawiyati state lives in two stores: PostgreSQL (durable — users, sessions schema, KYC, SP config, audit) and Redis (transient — active sessions, OTP codes, rate limits, SP config cache). Only PostgreSQL requires persistent backup; Redis data is rebuildable.
3.1 PostgreSQL Backup
- Daily full backup:
pg_dump -Fc hawiyati > hawiyati-$(date +%Y%m%d).dump - Continuous WAL archiving: enables point-in-time recovery (PITR) to any minute. Configure
archive_mode=onandarchive_commandinpostgresql.conf - Backup storage: separate host or encrypted object storage (S3-compatible). Never on the same host as the DB.
- Encryption: encrypt backups at rest (GPG or storage-level encryption)
- Verification: weekly automated restore test to a staging instance
3.2 Redis Backup
- Enable RDB snapshots every 6 hours (
save 21600 1in redis.conf) - Enable AOF with
appendfsync everysecfor durability - Copy RDB file to backup storage after each snapshot
- Note: Redis loss means active sessions are invalidated — users must re-authenticate. This is acceptable in most recovery scenarios.
RPO (Recovery Point Objective): <1 hour of data loss with WAL archiving enabled. Without WAL archiving (daily pg_dump only), RPO is up to 24 hours — this is NOT acceptable for production.
3.3 Restore Procedure
- Stop all Hawiyati services — stop in reverse start order: scim → admin → http-server → gateway → gRPC services
- Restore PostgreSQL —
pg_restore -d hawiyati hawiyati-YYYYMMDD.dump - Apply WAL to target point-in-time (if PITR needed) — configure recovery.conf and start PostgreSQL in recovery mode
- Verify Flyway migration state —
SELECT version, description FROM flyway_schema_history ORDER BY installed_rank DESC LIMIT 5;— confirm V62 (or later) is present - Restore Redis snapshot — copy RDB file to Redis data dir, restart Redis
- Start services in order — hawiyati-infra/cache/session (gRPC) first, then hawiyati-http-server, then hawiyati-admin and hawiyati-scim
- Smoke test — perform a test login, verify an audit event was written, check admin console loads
4. Disaster Recovery
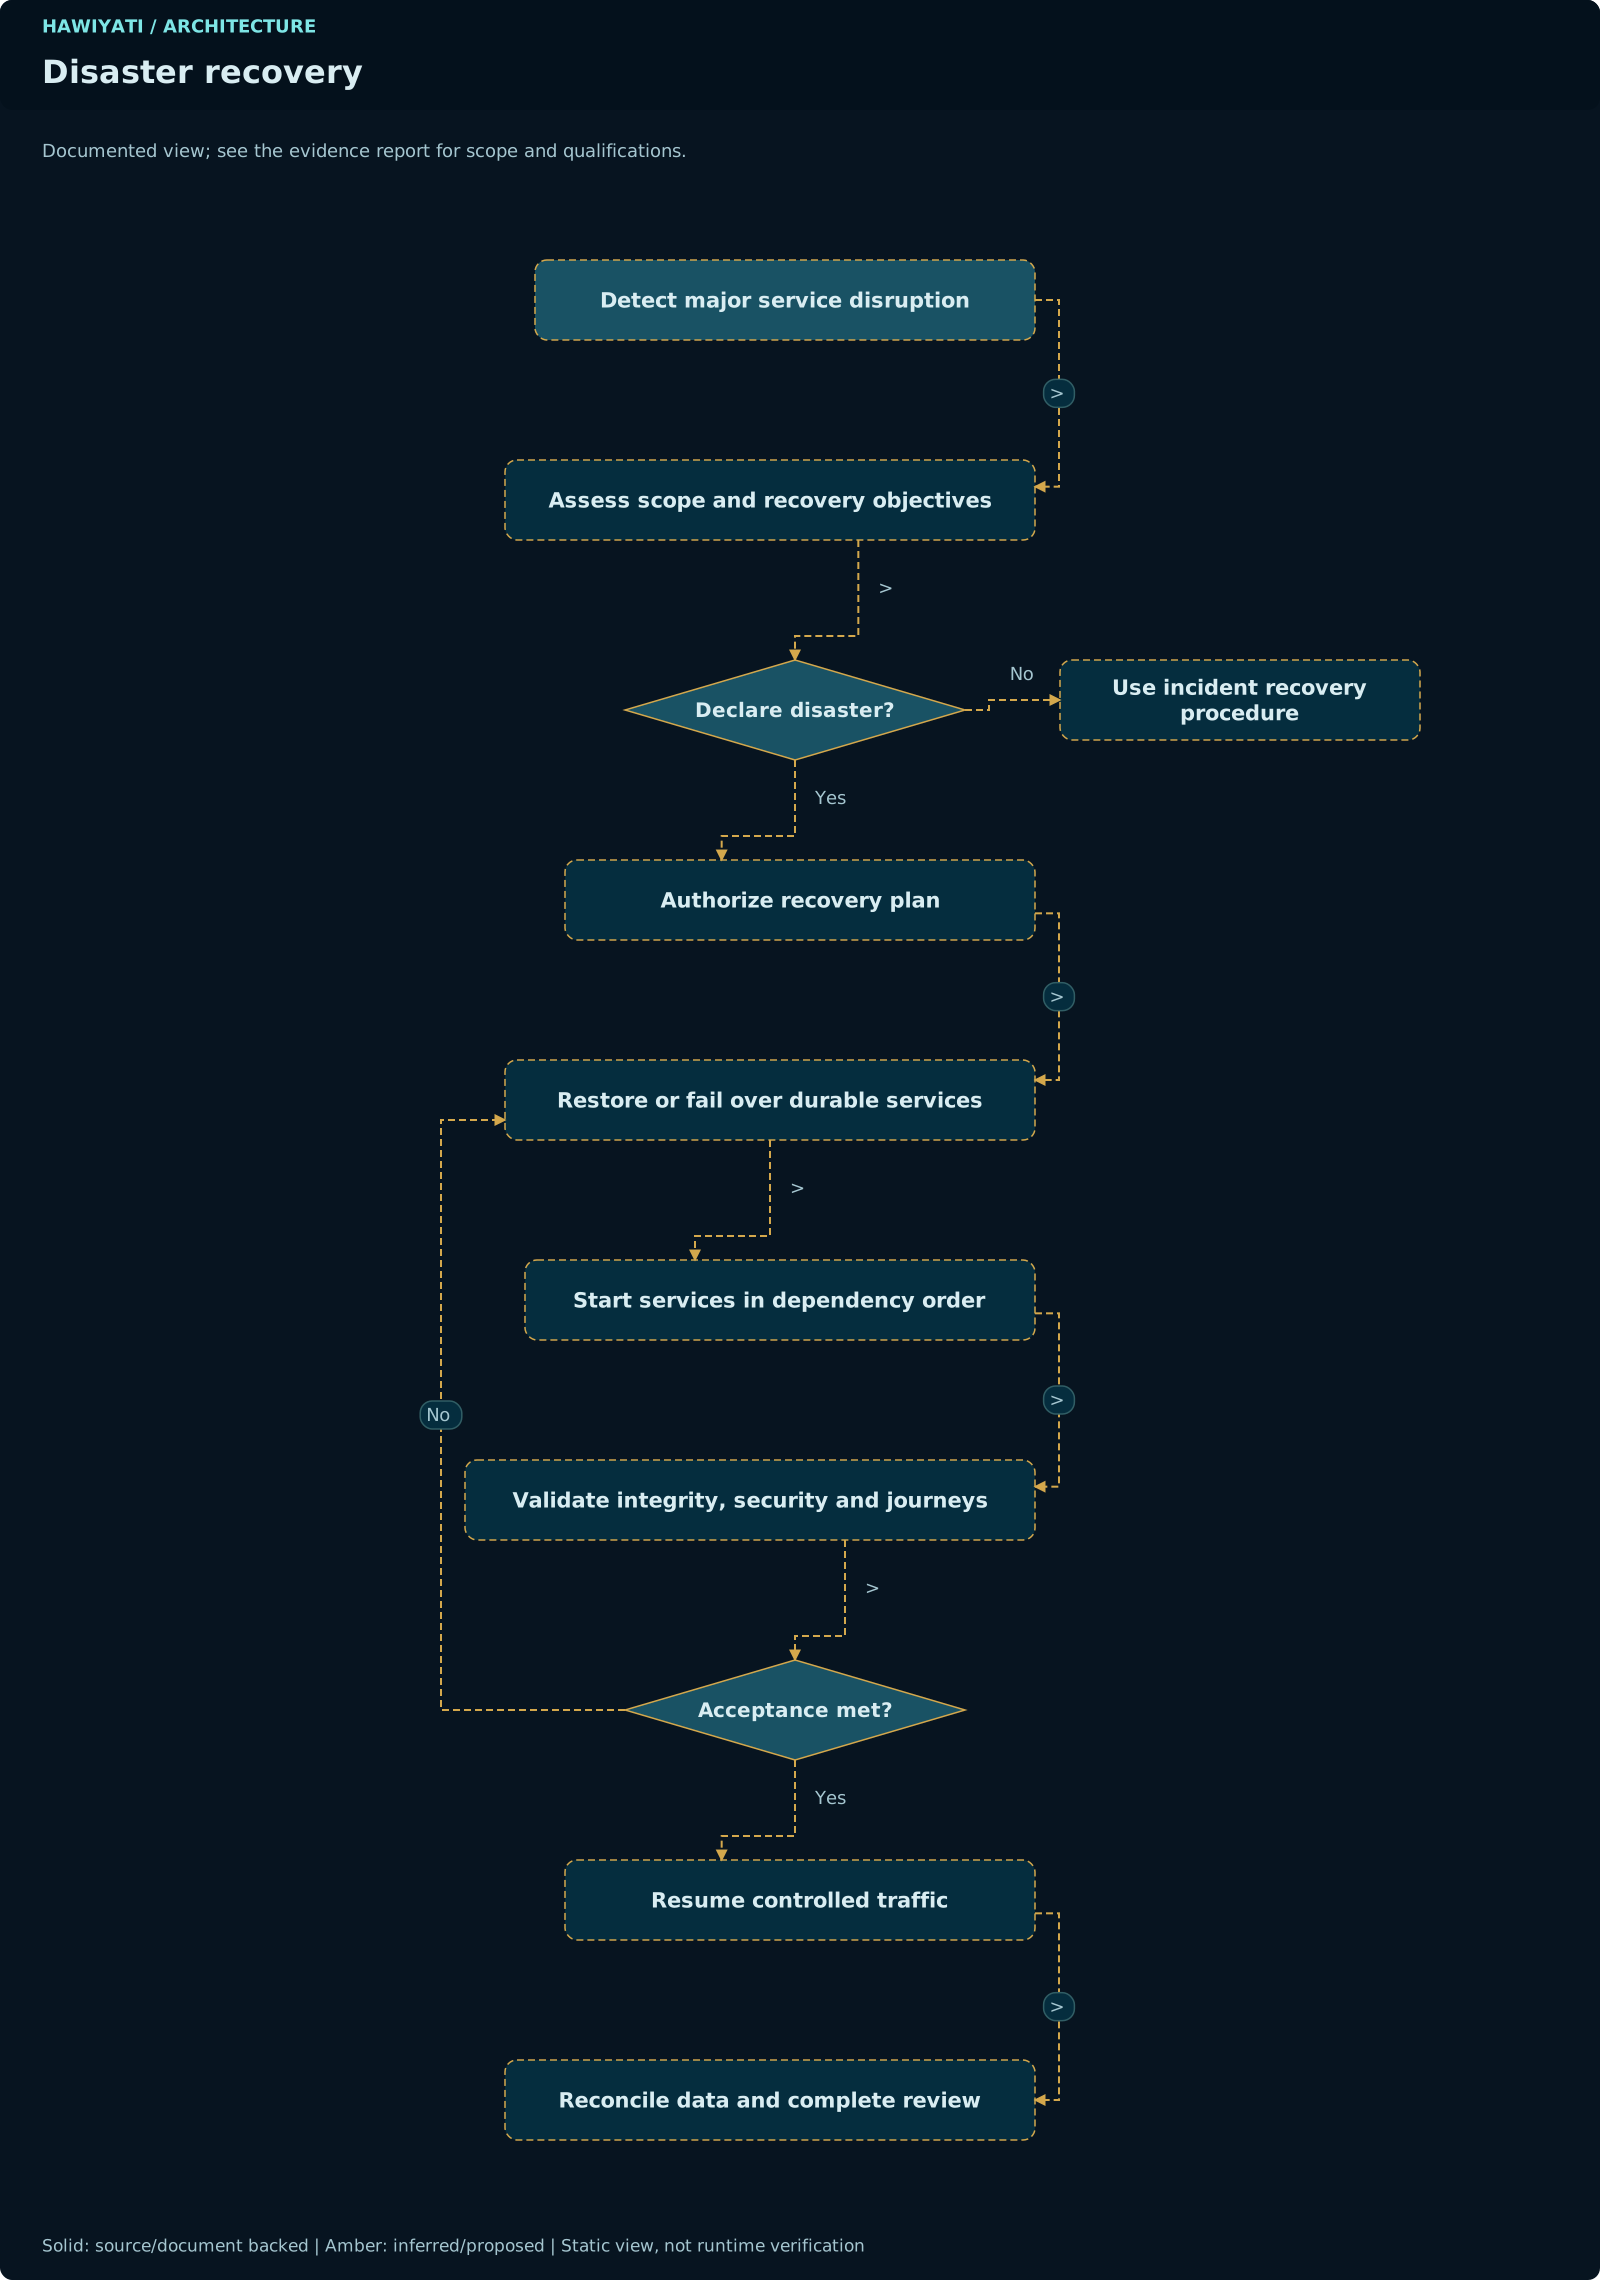
Hawiyati supports an active-passive DR model. Active-active is not recommended due to SAML state coupling (InResponseTo correlation, session continuity).
4.1 DR Architecture
| Component | DR Method | Notes |
|---|---|---|
| PostgreSQL | Streaming replication to standby | Standby is read-only replica; promote on failover |
| Redis | Redis Sentinel or Cluster | For session HA; acceptable to lose in-flight sessions |
| Application services | Stateless — restart on standby hosts | JARs and config must be available on standby |
| TLS certificates | Copy to standby, same hostname | Certificate must match production DNS name |
4.2 Failover Procedure
- Alert fires on primary failure — confirm primary is truly down (check /actuator/health, attempt DB connection). Do NOT proceed if split-brain is possible.
- Verify primary is unreachable — ping, TCP check, attempt pg_isready from standby host
- Promote PostgreSQL standby —
pg_promote()orpg_ctl promote -D /var/lib/postgresql/data - Update load balancer / DNS — point application VIP or DNS record to standby host (TTL should be pre-set low: 60s)
- Flush Redis on standby —
FLUSHALLto clear any stale state. Active sessions are lost; users must re-authenticate. - Start Hawiyati services on standby — same start order as primary: gRPC services first, then HTTP services
- Smoke test — test login via a canary SP, verify audit log write, check admin console
4.3 Failback Procedure
After the primary host recovers:
- Re-sync PostgreSQL: stream WAL from current primary (standby) back to recovered host
- Verify data consistency on recovered host
- Switch DNS/load balancer back to primary host
- Demote standby to replica
- Monitor for 30 minutes before declaring primary restored
4.4 DR Test Schedule
Conduct a full DR failover test quarterly. The test should:
- Simulate primary host failure (stop services and DB)
- Follow the failover procedure above end-to-end
- Measure actual RTO against target (<4h)
- Document findings and update the DR runbook
5. Upgrade & Rollback
Hawiyati uses Flyway for schema migrations. Flyway runs automatically on service startup — new migration scripts (Vxx__description.sql) are applied in version order. Zero-downtime upgrades are not currently supported; schedule a maintenance window.
5.1 Upgrade Procedure
- Read the release notes — identify any breaking changes, new required configuration, or manual pre-migration steps
- Test in staging — run new JARs against a copy of production data. Verify all Flyway migrations succeed and smoke tests pass.
- Backup production database —
pg_dump -Fc hawiyati > pre-upgrade-$(date +%Y%m%d-%H%M).dump - Schedule maintenance window — notify SP owners and affected users; set maintenance page at load balancer if available
- Stop services — stop in reverse order: SCIM → Admin → HTTP Server → Gateway → gRPC services
- Deploy new JARs — replace JAR files and update application.yml if new configuration keys are required
- Start services — gRPC services first, then HTTP services. Flyway runs migrations automatically on first startup. Watch logs for migration success.
- Smoke test — test login, MFA, SP federation, admin console, audit log write
- Monitor for 1 hour — watch error rate, login latency, and session count metrics
5.2 Rollback Procedure
- Stop all services
- Restore previous JARs — keep previous version in a versioned deploy directory
- Restore pre-upgrade database backup —
pg_restore -d hawiyati pre-upgrade-YYYYMMDD-HHMM.dump - Start services with previous JARs — Flyway will confirm current schema version matches and skip migrations
- Smoke test and monitor
5.3 Flyway Migration Naming
Migration files follow the convention: V{version}__{description}.sql (double underscore). Example: V54__add_claim_token_table.sql. The current schema head is V62. Never manually edit or delete applied migration records in flyway_schema_history.
6. Routine Maintenance Schedule
Preventive maintenance keeps the platform healthy and avoids reactive incidents. Assign ownership for each task in your operations runbook.
| Frequency | Task | Owner |
|---|---|---|
| Weekly | Check disk usage on DB host, log host, and backup storage (alert at >70%) | Ops |
| Review failed login anomalies in audit logs — look for velocity or pattern shifts | Security | |
| Verify backup completion logs — confirm daily pg_dump and RDB snapshot ran successfully | Ops | |
| Check TLS certificate expiry for all hostnames — alert if <60 days remain | Ops | |
| Monthly | Rotate Redis AUTH password — update in application.yml and restart services | Ops |
| Review admin operator accounts — disable or delete accounts for staff who have left | Security | |
| Review and rotate SCIM bearer tokens — reissue tokens for connected provisioning systems | Ops + SP owners | |
| Review risk engine configuration vs recent incident data — adjust thresholds if needed | Security | |
| Quarterly | DR failover test — follow full failover procedure, measure RTO | Ops |
| Penetration test scope review — confirm coverage of new SPs or features | Security | |
| Certificate rotation (if due) — renew all TLS certs before expiry | Ops | |
| Dependency vulnerability scan — check Hawiyati's dependency tree against CVE database | Security | |
| Review and purge expired KYC sessions — clean up stuck IN_PROGRESS sessions older than policy threshold | Ops + Compliance | |
| Annually | Full security audit — review access controls, encryption config, audit log integrity | Security |
| Key rotation review — rotate SAML signing key and OIDC JWK set (rolling update) | Security + Ops | |
| Compliance assessment — review NIST SP 800-63 alignment, assurance level configuration | Compliance | |
| Disaster recovery plan review — update runbook, retest failback procedure | Ops |
7. Capacity Planning
Plan capacity at least 6 months ahead. The primary scaling constraints are PostgreSQL (write throughput and disk) and Redis (memory for active sessions).
7.1 Sizing Formulas
| Resource | Estimate Formula | Example (10,000 concurrent users) |
|---|---|---|
| Redis memory (sessions) | ~2 KB/session × peak concurrent sessions × 2 (buffer) | 2 KB × 10,000 × 2 = 40 MB |
| Redis memory (OTP + rate limits) | ~0.5 KB/user in active MFA flow × concurrent MFA attempts | Typically <100 MB additional |
| Audit log disk growth | ~500 bytes/event × events/day | 1M events/day = ~500 MB/day = ~15 GB/month |
| PostgreSQL data growth | Audit log dominant; user/session tables much smaller | 1M users ≈ 2 GB for identity tables |
| Application CPU | ~0.1 CPU core per 100 concurrent logins (p95 <500ms) | 1,000 concurrent logins → ~10 cores across http-server instances |
7.2 Scaling Approach
Horizontal scaling (application tier): hawiyati-http-server and hawiyati-admin are stateless — sessions are Redis-backed. Add instances behind a load balancer (sticky sessions not required). gRPC services (infra, cache, session) are also stateless and can be replicated.
Database scaling: PostgreSQL is the primary bottleneck. Add read replicas for reporting and audit log queries. Use connection pooling (PgBouncer) to handle high connection counts. Partition the audit_events table by month for large deployments.
7.3 Scaling Signals
7.4 Redis Eviction Monitoring
# Check Redis memory and eviction stats
redis-cli INFO memory | grep -E 'used_memory_human|maxmemory_human|mem_fragmentation'
redis-cli INFO stats | grep -E 'evicted_keys|keyspace_hits|keyspace_misses'
Set Redis maxmemory-policy allkeys-lru in production. Monitor evicted_keys — if evictions are occurring on session keys, sessions are being lost before expiry, which causes unexpected logouts. Increase maxmemory or purge stale keys.
8. Incident Response
A well-rehearsed incident response process minimises mean time to recovery (MTTR). Define roles, communication channels, and escalation paths before your first production incident.
8.1 Severity Matrix
| Severity | Response SLA | Communication | Escalation |
|---|---|---|---|
| P1 | 15 minutes | Immediate pager + status page update | Ops lead + Security lead |
| P2 | 1 hour | Slack ops channel + affected SP owners | Ops lead |
| P3 | 4 hours | Ticket + affected team notification | Ops on-call |
| P4 | Next business day | Ticket | Ops team |
8.2 Common Runbooks
These runbooks should be documented in your ops wiki with step-by-step procedures:
| Runbook | When to Use | Key Steps |
|---|---|---|
| Auth service restart | hawiyati-http-server unresponsive | Health check → log triage → graceful restart → smoke test |
| Redis failover | Redis connection failures alert fires | Check Redis health → fail to replica → flush stale state → restart services |
| PostgreSQL failover | DB unreachable, primary host failure | See DR failover procedure (Section 4.2) |
| Emergency certificate renewal | Cert expired or <14 days remaining | Issue new cert → update keystore → rolling restart |
| Account lockout storm | Mass lockout from velocity attack or misconfiguration | Identify source → blocklist IP → bulk unlock affected accounts via admin API |
| Rate limit incident | Legitimate users hit rate limits | Identify trigger → temporary threshold increase → investigate root cause |
8.3 Post-Incident Review
For every P1 and P2 incident, conduct a post-incident review within 48 hours. The review template:
| Section | Content |
|---|---|
| Incident timeline | Exact timestamps: detection, declaration, diagnosis, mitigation, resolution |
| Root cause | Technical root cause (5-whys analysis) |
| Impact | Number of affected users, duration, SPs impacted, estimated auth failures |
| Detection | How was the incident detected? Alert, user report, or internal discovery? |
| Response assessment | What went well? What was slow or missing? |
| Action items | Specific follow-up tasks with owners and due dates to prevent recurrence |